Business Planning
| SERIES 4.0 FEATURE |
Overview
Business Planning enables you to conduct long-term planning, scenario analysis, and business resilience planning covering a period of 6 or 12 months. You can estimate the impact of changes in work volumes, turnover, automation, process improvement, and operating efficiency on your staffing needs.
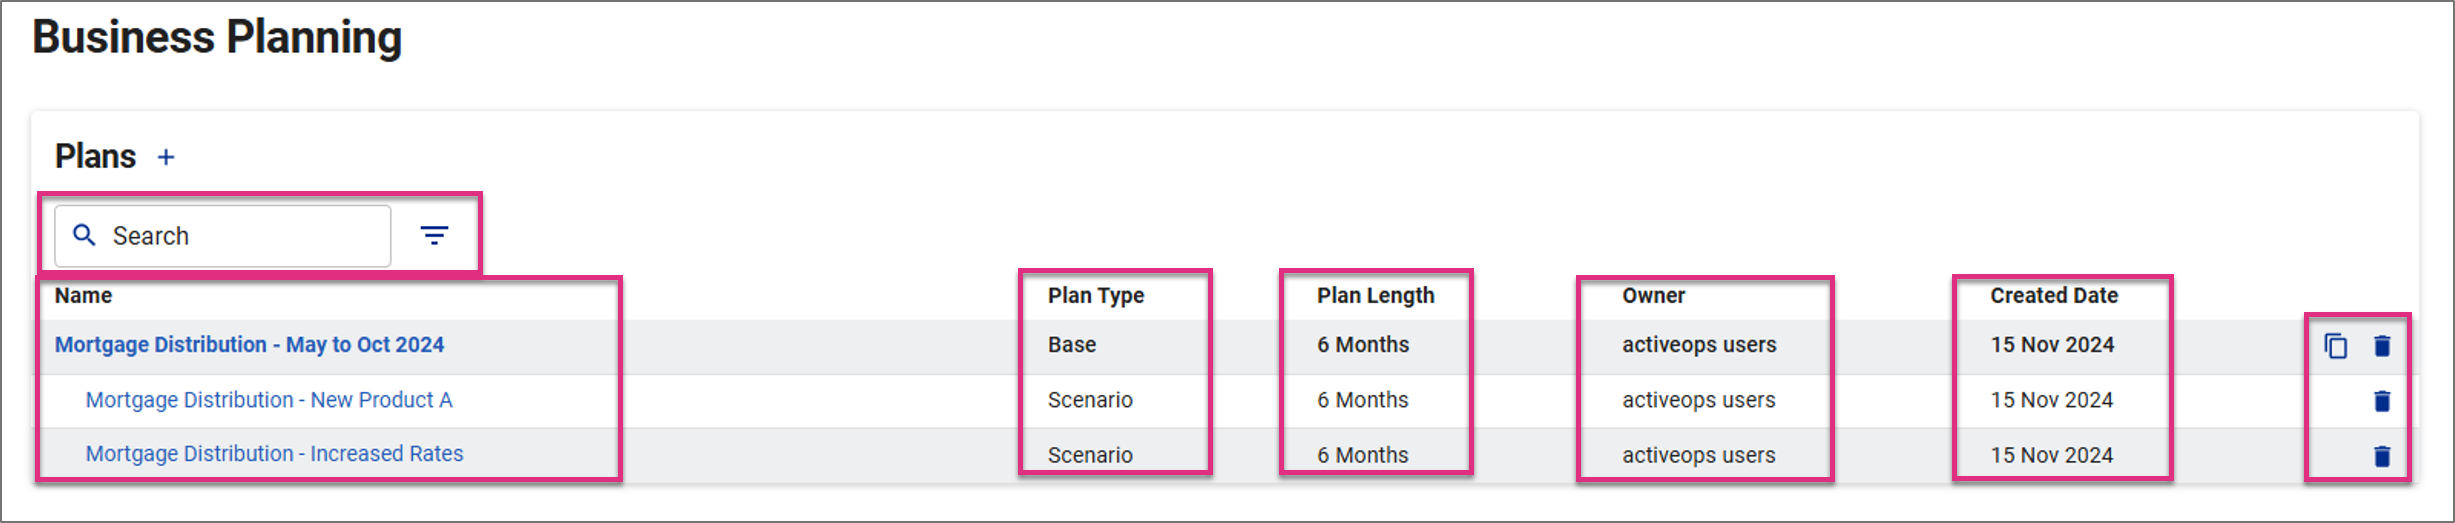
Search and Filter
Name
Plan Type
Plan Length
Owner
Created Date
|
 Allows you to refine the list of plans displayed in the plans screen by typing a partial or full plan name into the Search field.
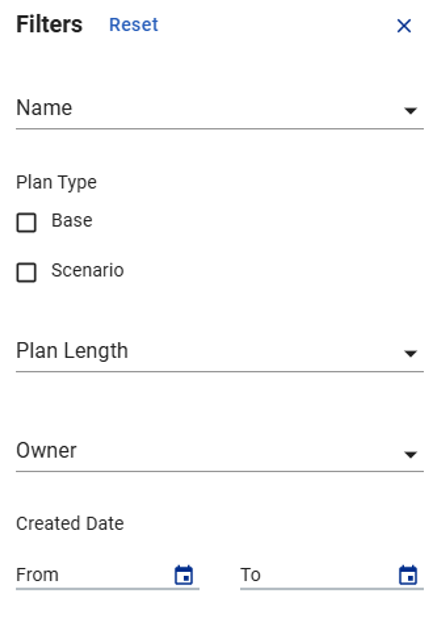


|
|
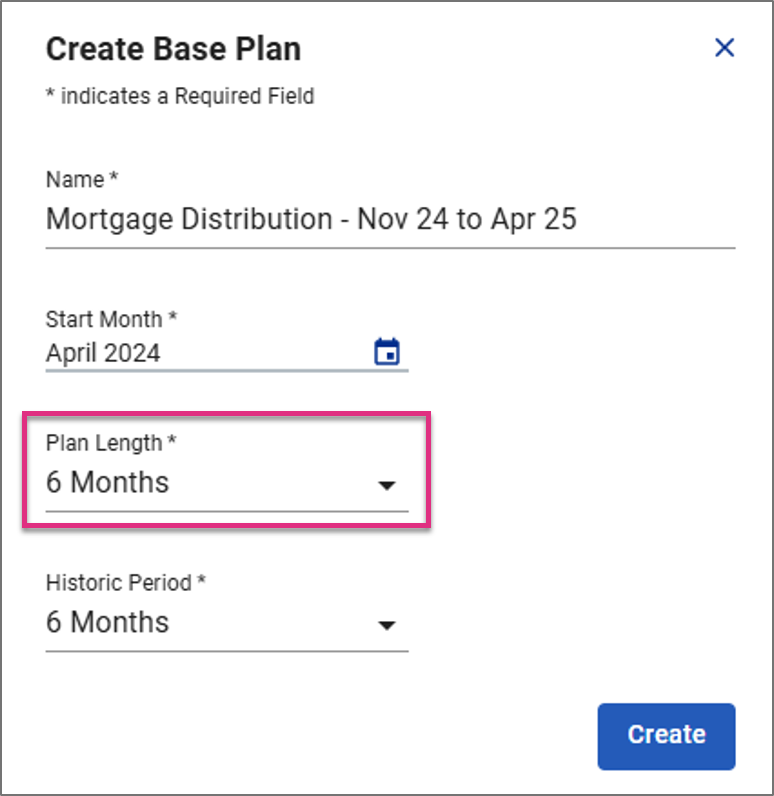
To create a Business Plan, select the  icon next to the Plans header in the Business Planning screen.
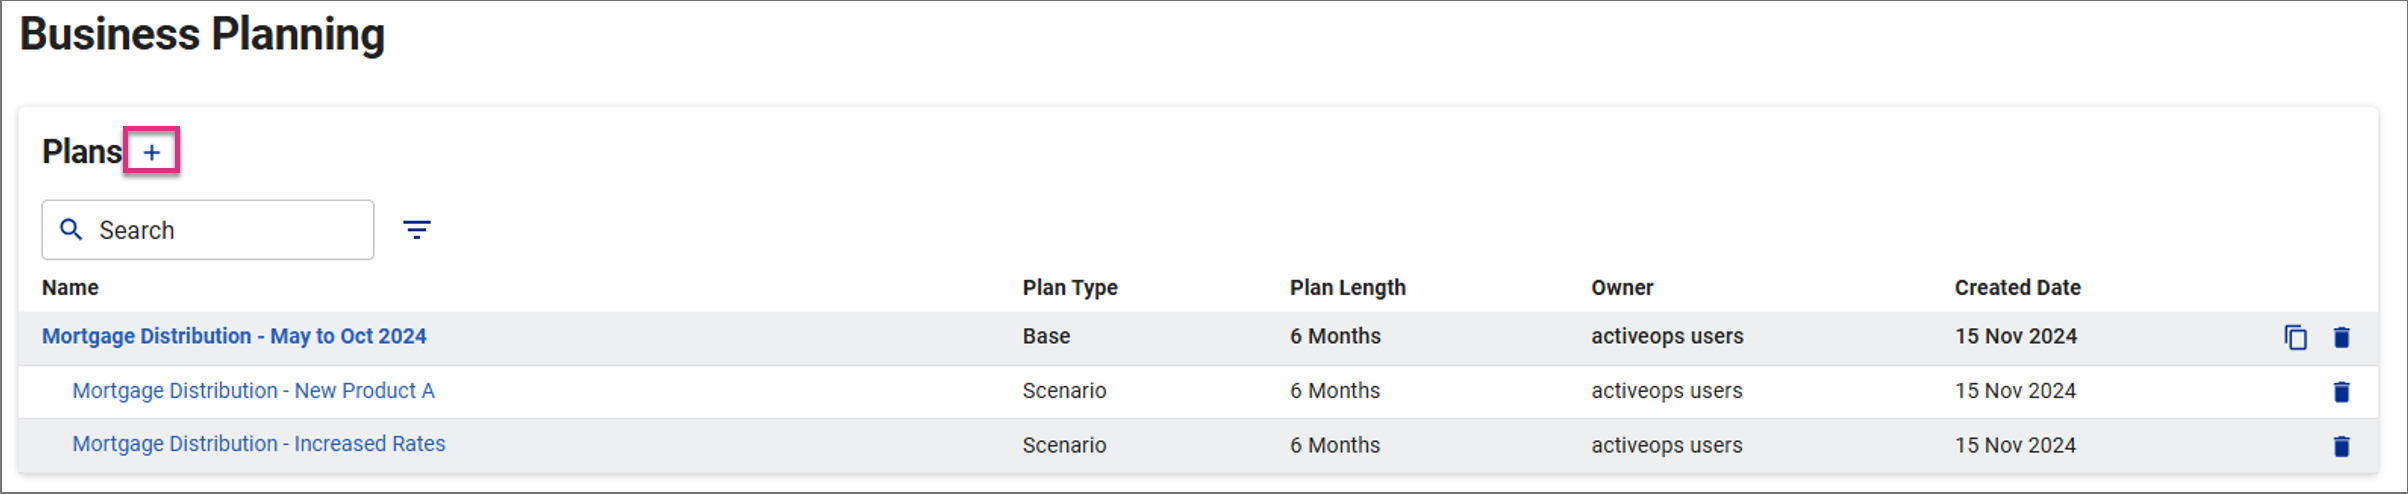
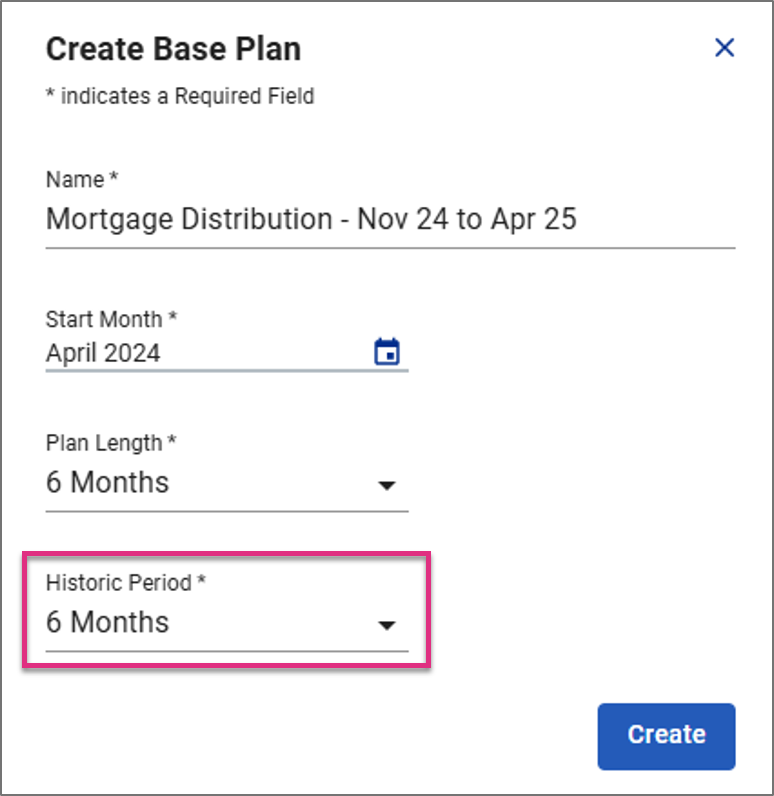
This will prompt the Create Plan dialogue box to open.
|
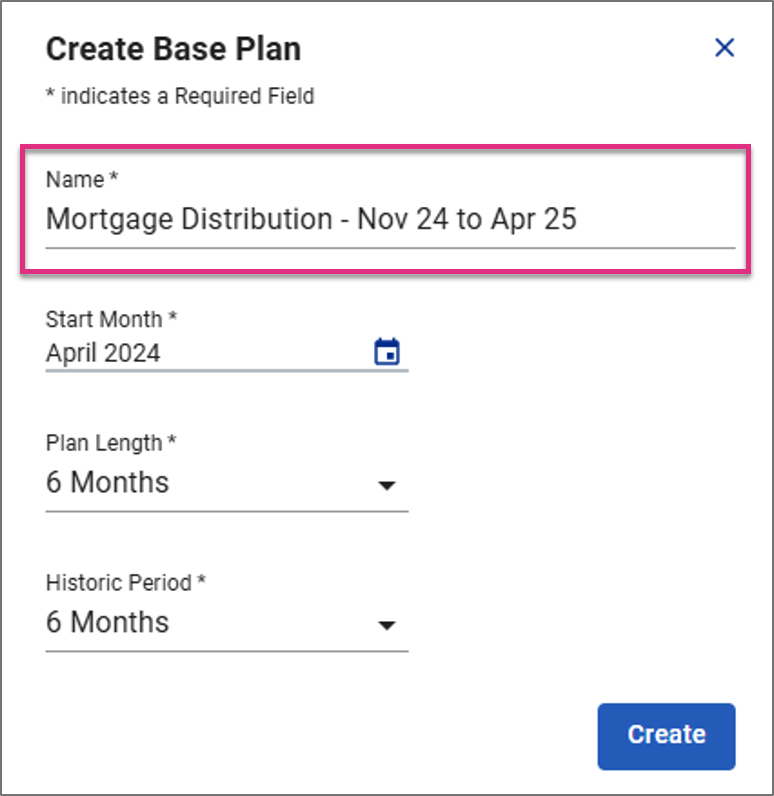
 icon to access the calendar function or type the full name and year directly into the cell
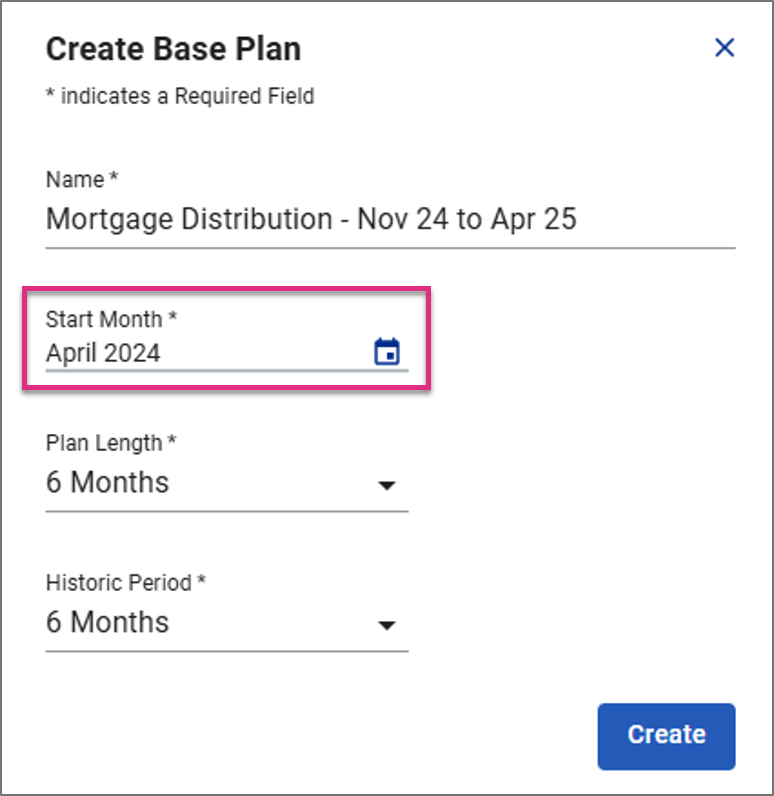
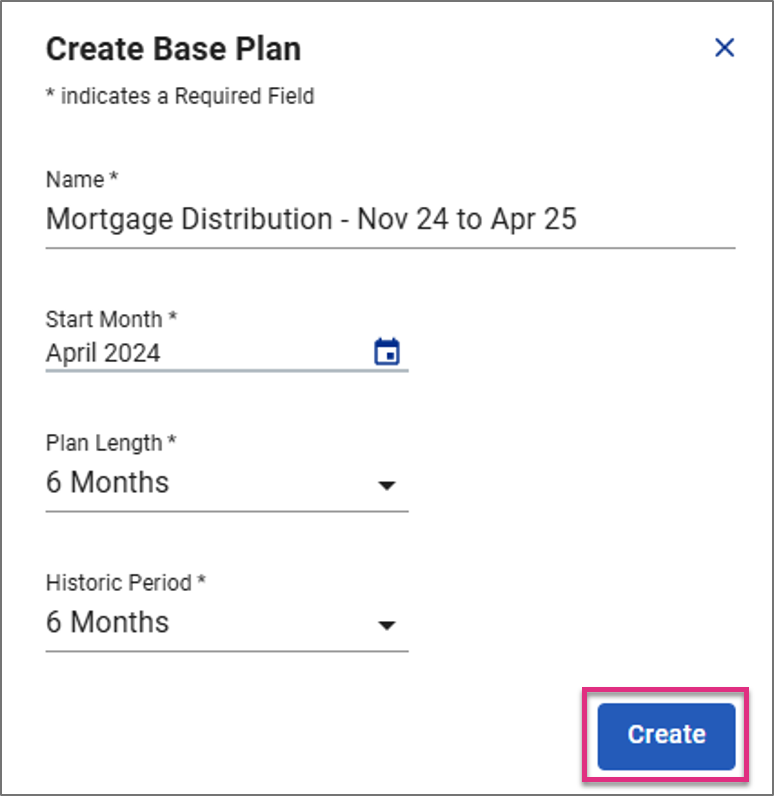
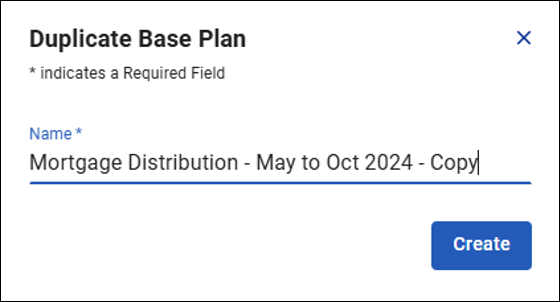
Once you click the create button your Base Business Plan will open.
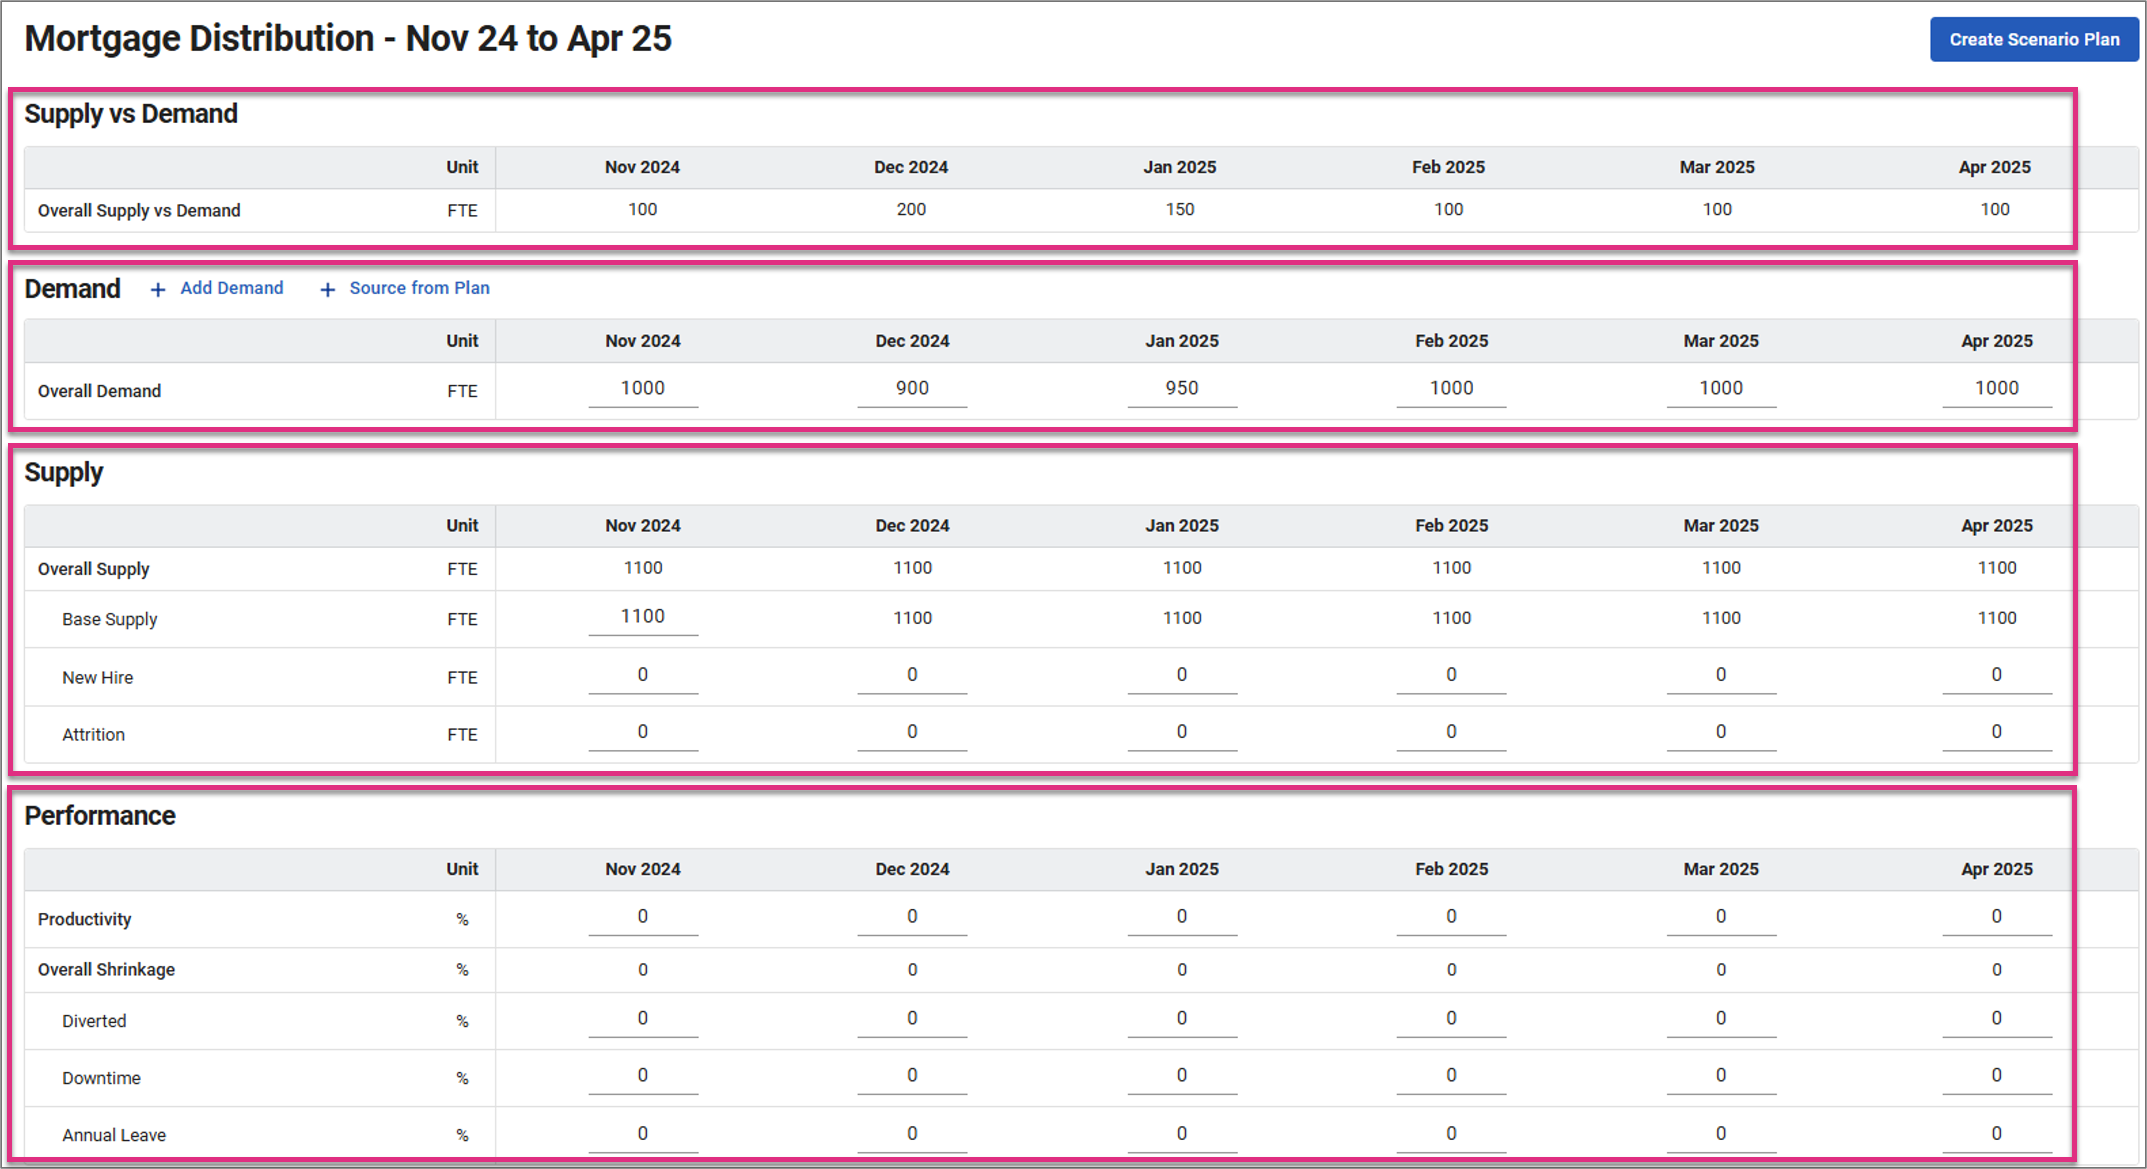
Supply v Demand
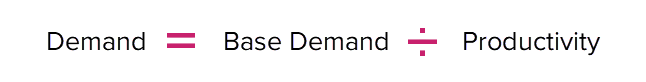
Demand
Supply
Performance
|

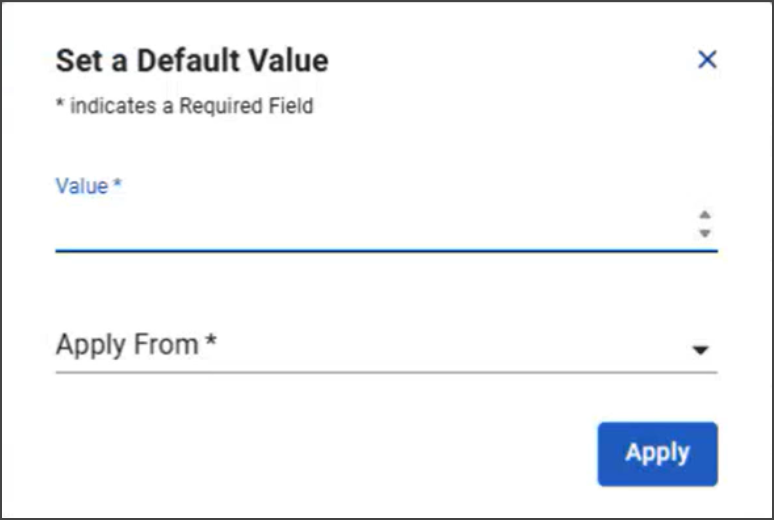
Set as Default -  allows you to quickly apply a value to a range of cells. Clicking on the Set as Default button will display the dialogue box for setting the value and Apply From:
The detail displayed in your Demand section can be increased by adding Business Outcomes or Case Categories or Types allowing for a more detailed view of your anticipated Demand.
To add a Business Outcome or Case select the  button. This will prompt the Add Demand dialogue box to open.
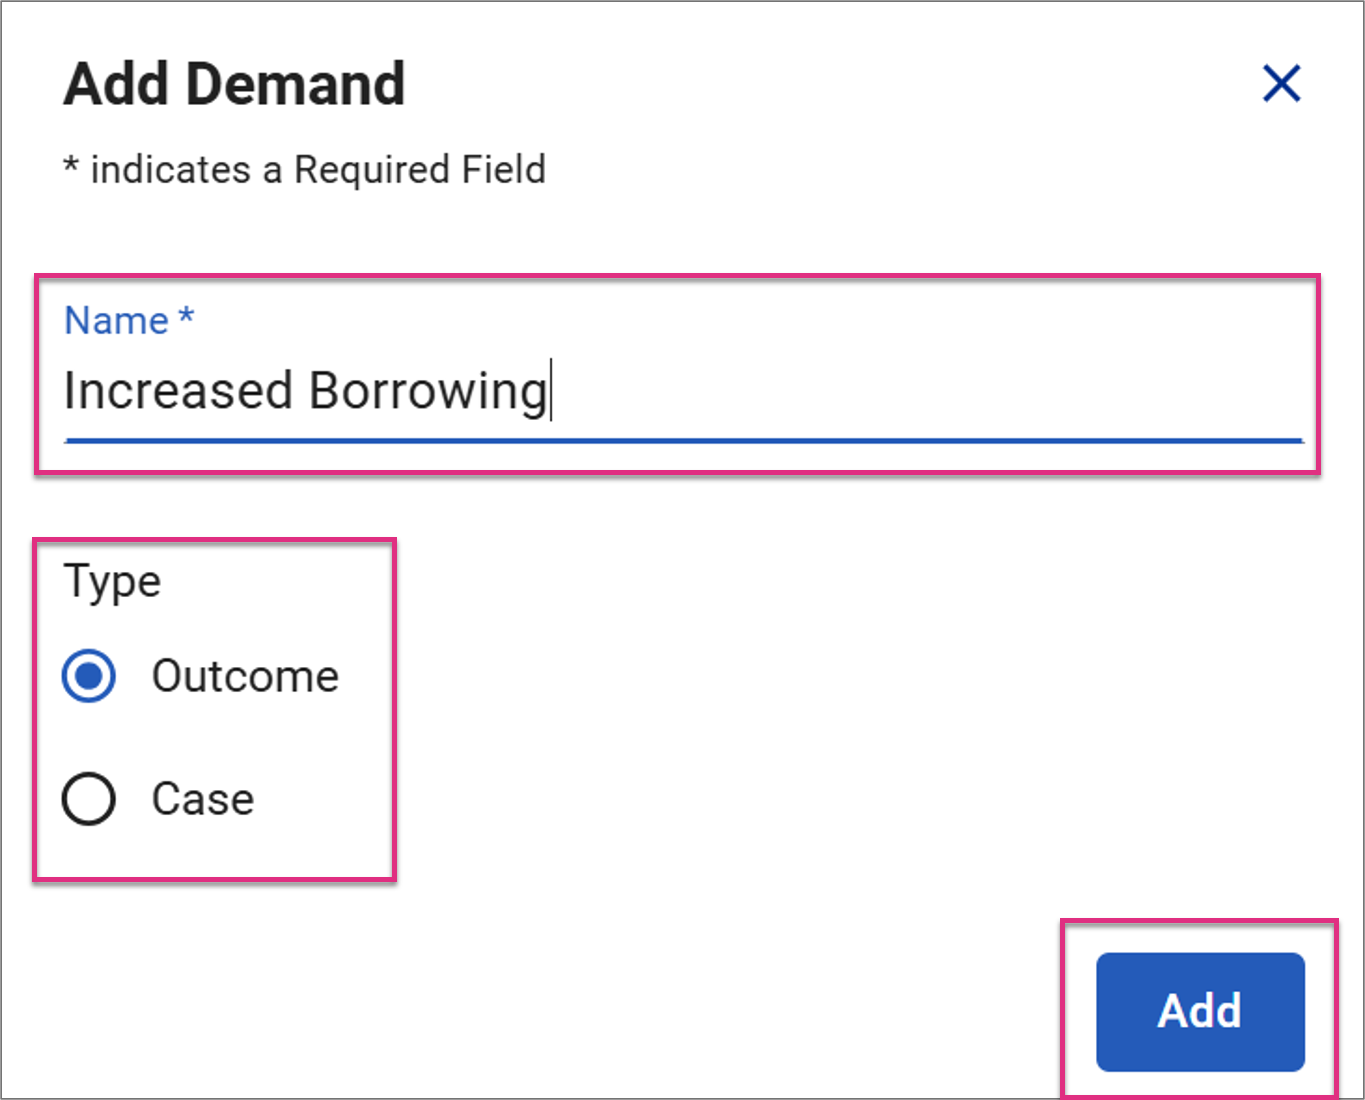
Enter the name of the Outcome or Case, indicate if it is classified as an Outcome or Case and click the Add button. The entry will then appear in your Business Plan below your Overall Demand. You can then add anticipated demand for each of your Outcomes or cases to provide a more detailed view of demand.
If you Add Demand to an existing base plan it will warn you that it will reset the previous demand figures:

If you have built Business Plans covering previous months you can Source the Base Demand data from those by selecting the Source from Plan button 
This will prompt the Select Plan to Import Data From dialogue box to open.
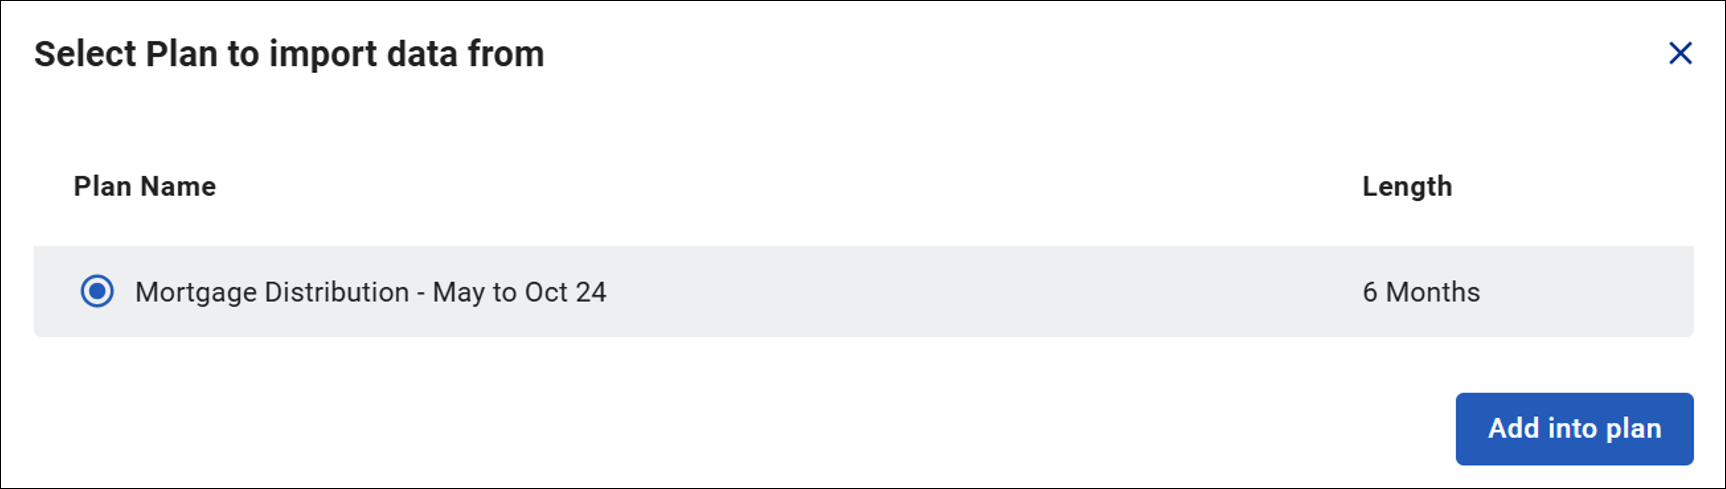
Select the plan you would like to source data from and click the Add into Plan button. You can source demand from a previous plan if:
-
No Outcomes or Cases have been created in the current plan.
-
The plan being sourced from is a plan type “Base” and matches the plan length of the plan the user is sourcing to.
All the demand data from the selected plan will now appear in your current plan. If you added Outcomes or Cases to the Demand section of the plan you are sourcing from this data will pull through.
Sourced data can be amended by typing the required value directly into the relevant cell.
Once you have created your Base Business Plan you can begin to add scenarios to understand how different situations will impact your Demand v Supply capacity.
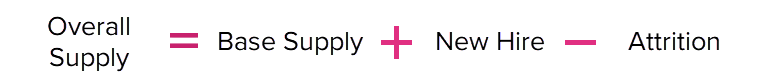
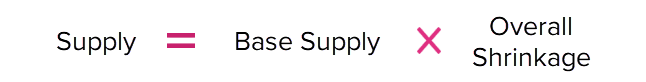
Your Overall Supply is
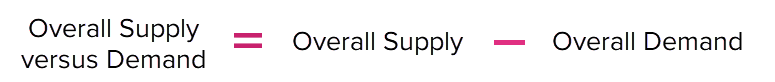
And your Overall Supply versus Demand is
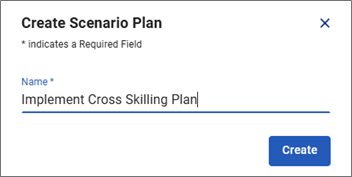
To create a Scenario Plan, click the Create Scenario Plan button.
This button will only be available to click if you have entered data for at least one of the plan months against the following metrics:
-
Overall Demand
-
Base Supply
-
Productivity
-
Overall Shrinkage

This will prompt the Create a Scenario Plan dialogue box to open where you can enter a name for your Scenario Plan indicating the scenario it represents.
Any number of scenario plans can be created from one base plan.
Once in a scenario plan, the values are sourced from the base plan. Therefore, if changes are made in the base plan, all linked scenario plans will be updated to reflect a change in these sourced values.
The values in an individual scenario plan can only be changed by applying scenarios.
When a scenario plan is created, it introduces the concept of true demand and true supply. This is achieved by factoring these metrics by the productivity and shrinkage values from the base plan.
In a scenario plan, the following is true
We apply this to each demand row in the scenario plan
We apply this to both Base Supply and New Hire rows in the scenario plan
A new plan will then be produced that uses the data entered in your Base Business Plan for Demand, Supply and Performance to provide a view of your anticipated Overall Supply and Demand position.
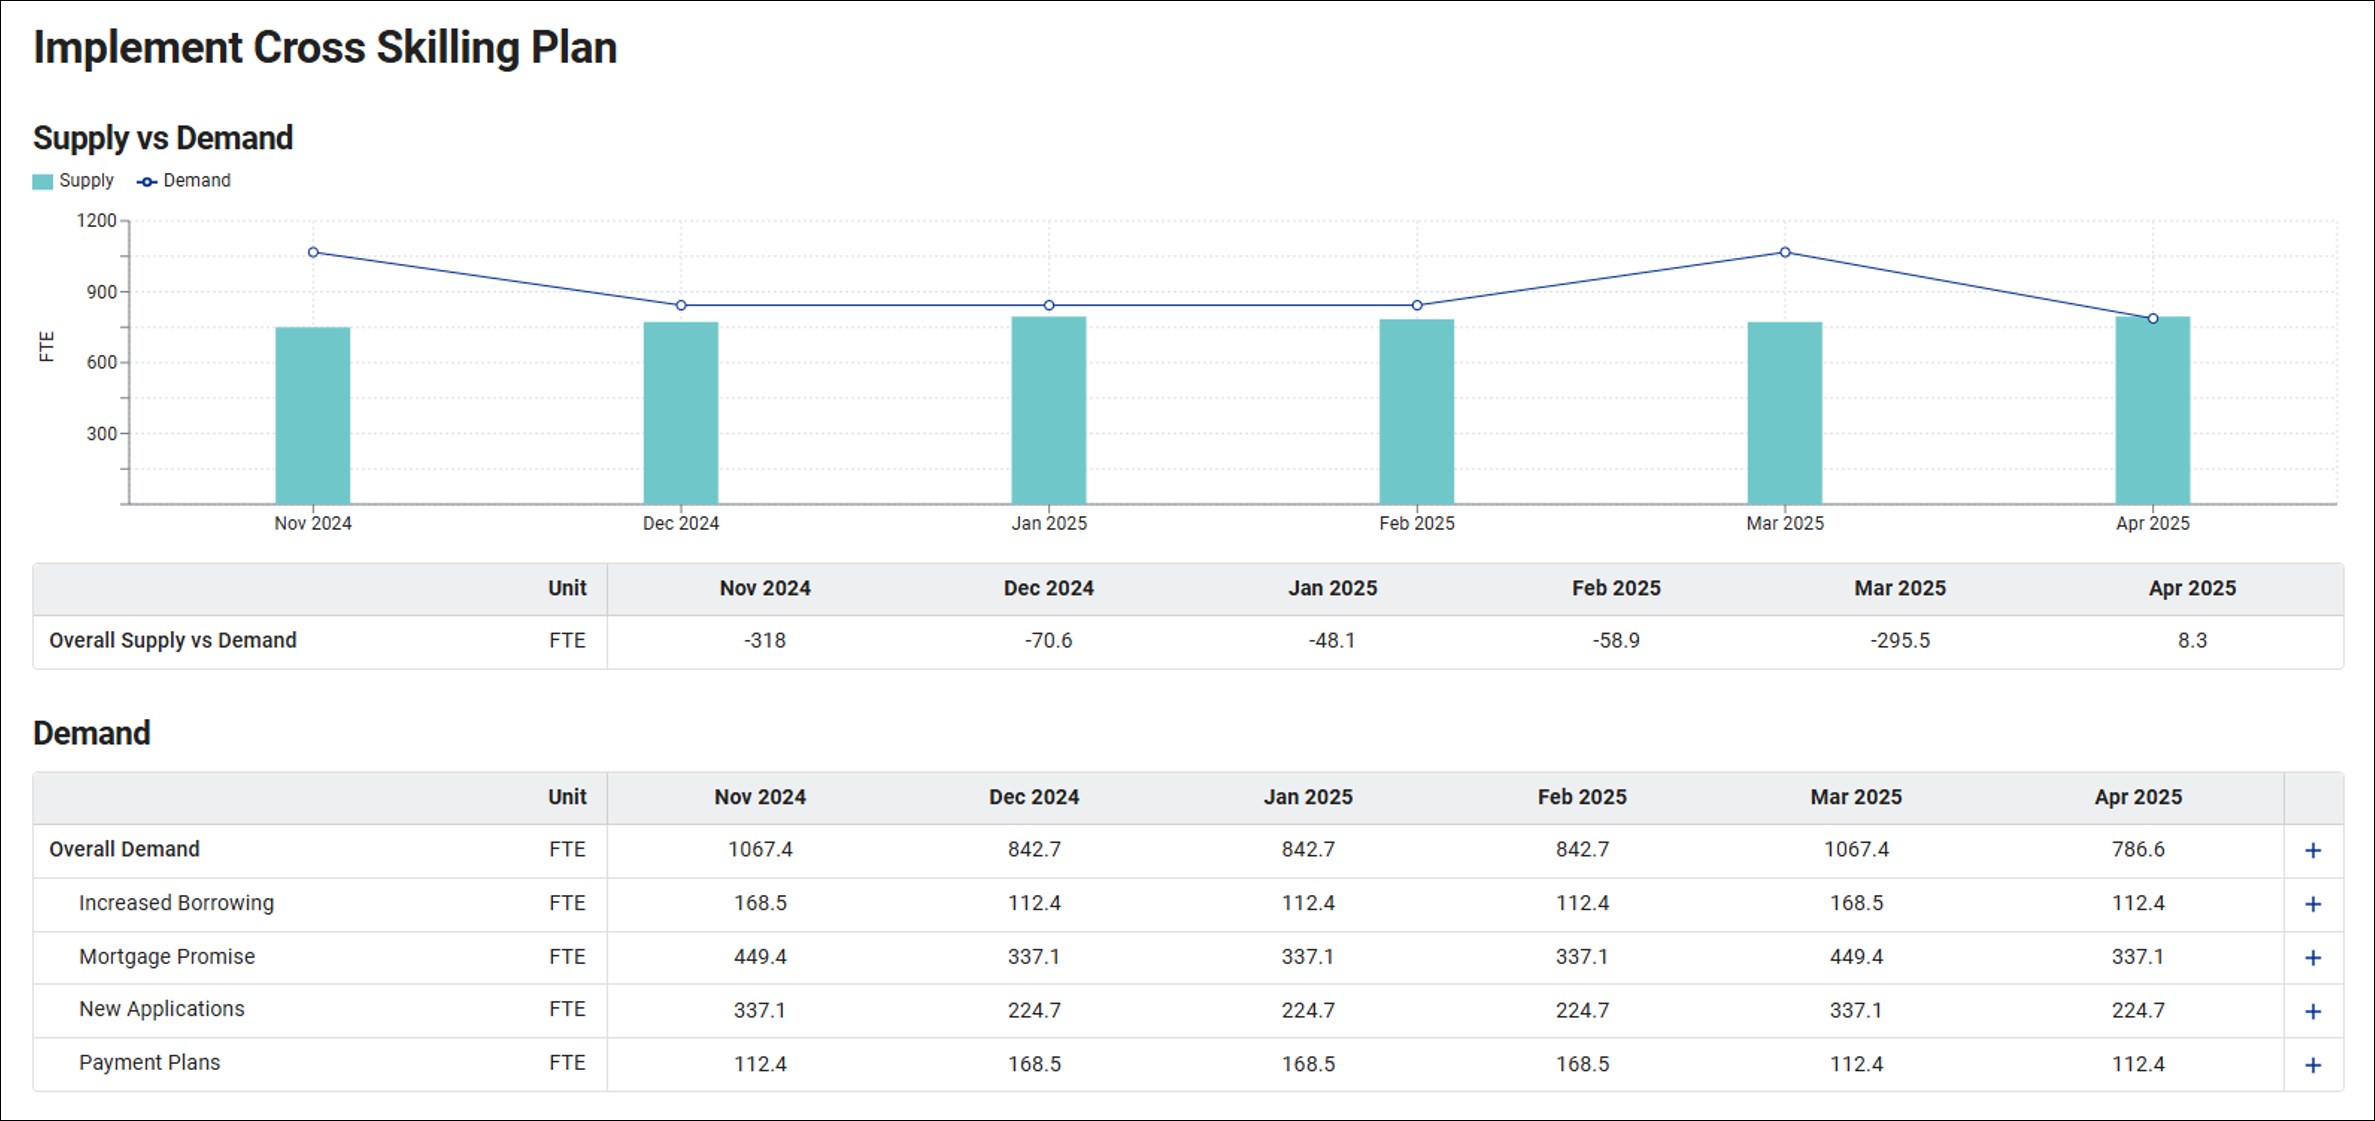
For each category within the Demand, Supply and Performance sections you can begin to add your scenarios. To do this click the button next to the element you wish to add a scenario to.
The Scenarios relevant to that element will then be displayed:
| Plan Item | Available Scenarios | Impact |
|---|---|---|
| Overall Demand | Add Demand |
When applied, there are no values from the base plan to consider, so the values the user enters in the scenario will just be factored by the productivity in the scenario plan and added to overall demand. Example: User Added Demand = 20 Scenario Plan Productivity = 95% Result = 20 / 0.95 = 21.1 |
| Outcome / Case Level Demand | Remove Demand |
This scenario will remove all demand relating to an outcome or case for the selected months, resulting in a decrease of Overall Demand. When applied, this scenario will change the value of an outcome or case from the base plan to 0. Example: Base Plan Outcome Demand = 50 **Remove Demand scenario is applied** Result = 50 – 50 = 0 |
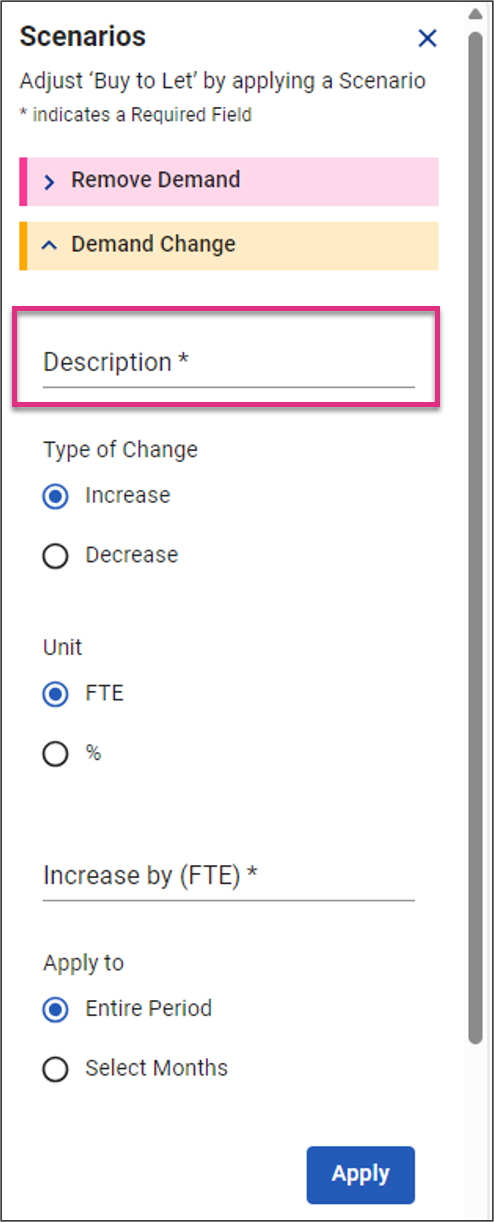
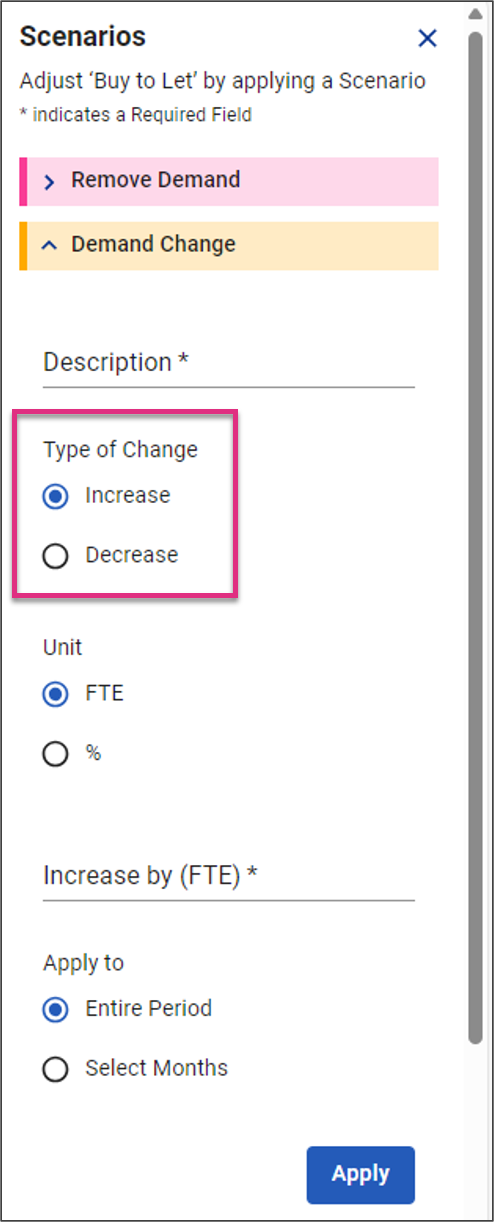
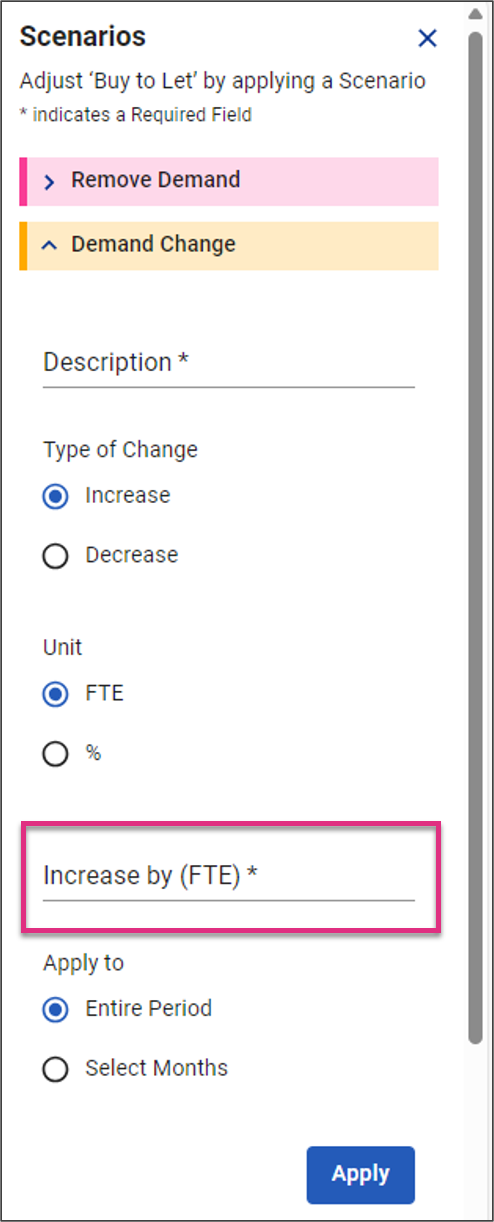
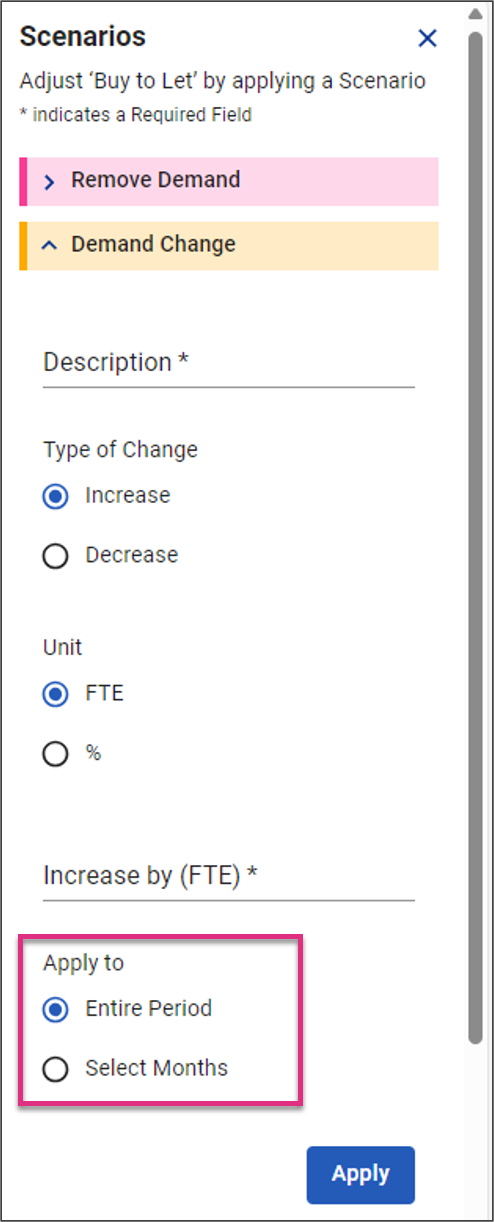
| Demand Change |
This scenario will increase or decrease demand by either an FTE or % value When applied, the value entered in the scenario will consider the original value in the base plan, and then re-factor this updated demand by the productivity value in the scenario plan. Example: Base Plan Overall Demand = 100 Demand Change Scenario = Increase by 10% Scenario Plan Productivity = 95% Result = 100 + 100*0.1 = 110 110 / 0.95 = 115.8 |
|
| Process Improvement |
This scenario will decrease demand by either an FTE or % value When applied, the value entered in the scenario will consider the original value in the base plan, and then re-factor this updated demand by the productivity value in the scenario plan Example: Base Plan Overall Demand = 100 Demand Change Scenario = Decrease by 10% Scenario Plan Productivity = 95% Result = 100 - 100*0.1 = 90 90 / 0.95 = 94.7 |
|
| New Hire | New Hire |
The result of this scenario will impact both the new hire and productivity rows in the plan; if the user decides to apply a learning curve. Without Learning Curve When the user applies this scenario, the FTE value entered for the number of new hires will be factored by the Overall Shrinkage value in the scenario plan. Example: Current Plan New Hire = 0 New Hire Scenario = 20 Current Plan Overall Shrinkage = 25% Result = 0 + 20 = 20 20 – (20 x 0.25) = 15 With Learning Curve If a user decided to apply a learning curve with the new hires they add to the plan, then the above will be true for providing the number of new hires to the plan, but in addition we will factor the productivity to account for the learning curve. Learning curve values can range from 0-100% - and the impacts on productivity will be carried through the plan until the new hires reach 100%. Each week of the learning curve must be populated with a value, and each value must be equal to or greater than the previous week of the curve. To factor the impact on productivity, we would first convert the weekly values provided in the learning curve to monthly values to match up with the plan, and then compute a number of calculations to arrive on the final impact. Example (using the previous example above to calculate the number of new hires): New Hire Scenario = 15 Learning Curve =
New Hires Monthly Effectiveness = Average (Weeks 1-4) = 62.5% Current Plan Overall Supply = 77.5 New Hire FTE (Factored by Monthly Effectiveness) = 15 x 62.5% = 9.4 Total FTE Supply = 77.5 + 9.4 = 86.9 Current Plan Productivity = 105% Final FTE Supply = 86.9 x 10⁵% = 91.2 Final Plan Productivity = 91.2 / (15 + 77.5) = 99% In this example, the original productivity in the plan was 105%, but due to the impact of 15FTE working at 62.5% effectiveness, the plan productivity changes to 99% |
| Attrition | Attrition |
This scenario will increase or decrease attrition by the desired amount, in FTE Example: Planned Attrition Value = 5 Attrition scenario = Increase by 2 Result = 5 + 2 = 7 |
| Productivity | Productivity Change |
This scenario will increase or decrease productivity by the desired amount, in % Example: Planned Productivity Value = 90% Productivity Change scenario = Increase by 5% Result = 90% + 5% = 95% This result will be the new productivity value that demand is factored by in the scenario plan |
| Diverted | Shrinkage Change |
This scenario will increase or decrease the selected shrinkage element by the desired amount, in % The result of this scenario will mean a change in the Overall Shrinkage Example: Planned Diverted Value = 10% Shrinkage Change scenario = Increase Diverted by 5% Result = 10% + 5% = 15% This result will feed the new Overall Shrinkage value that supply rows (base supply & new hire) are factored by in the scenario plan. |
| Downtime | Shrinkage Change | |
| Annual Leave | Shrinkage Change | |
| SLA Change |
The scenario will model the impact of changing the SLA associated with an outcome/case. This impact will be seen in the specific demand and overall productivity. The logic for this scenario is based on two assumptions:
As a result, the user will input the following variables:
Stored assumptions on the severity of the impact that the change will have over time will be applied, with the logic being that as you move further away from the point of change the lesser the impact. The following values are then used to calculate and model the expected impact that will be seen as a result ofthe SLA Change:
|
When you select the button next to the relevant line the Scenarios menu will open.
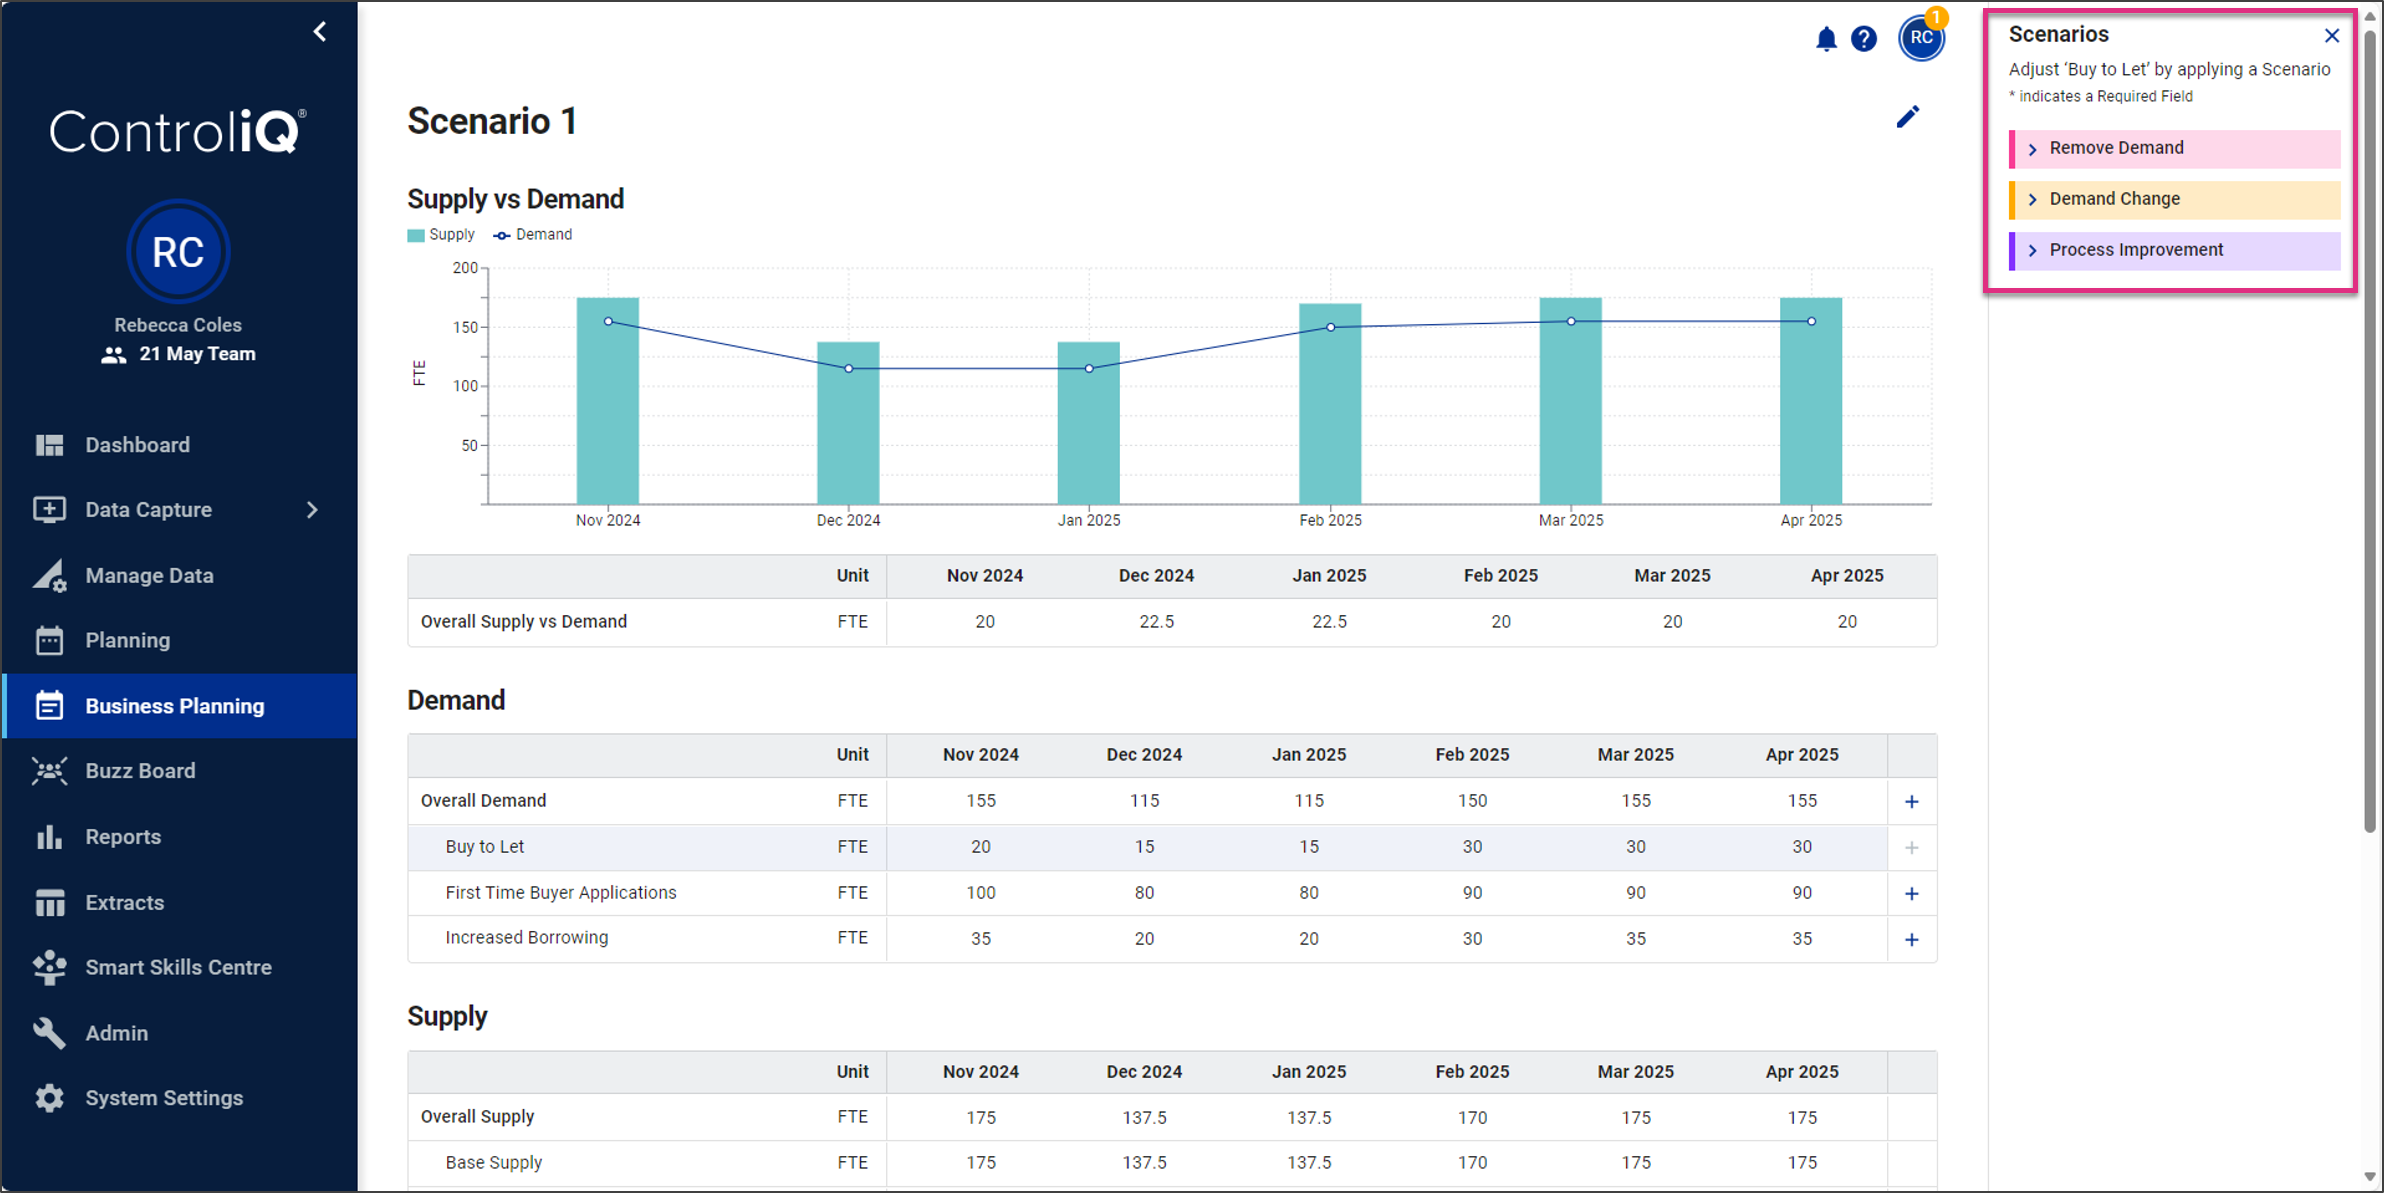
Click the ![]() icon next to the name of the Scenario you would like to apply to expand the Scenario setup form.
icon next to the name of the Scenario you would like to apply to expand the Scenario setup form.
|

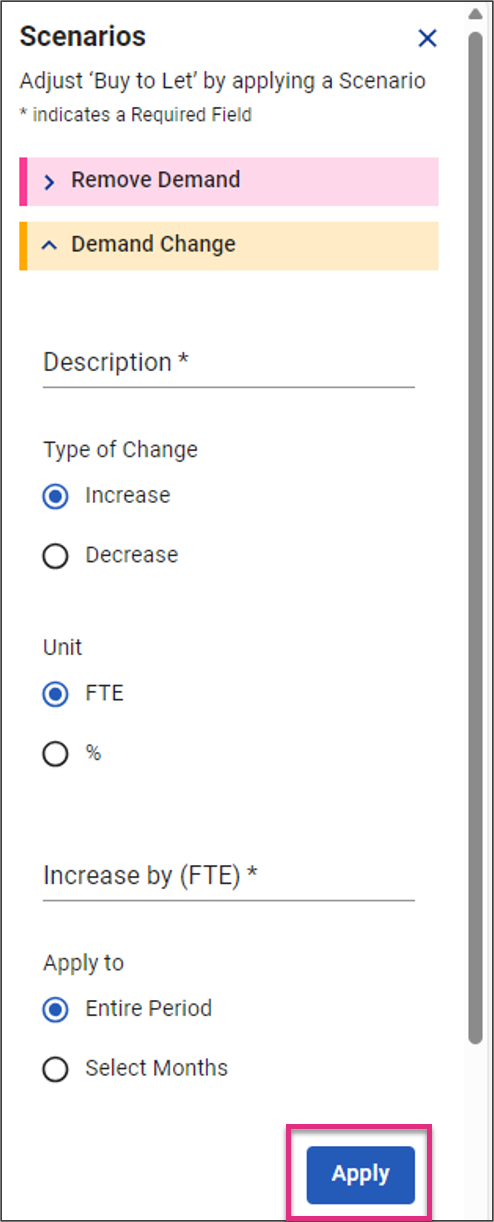
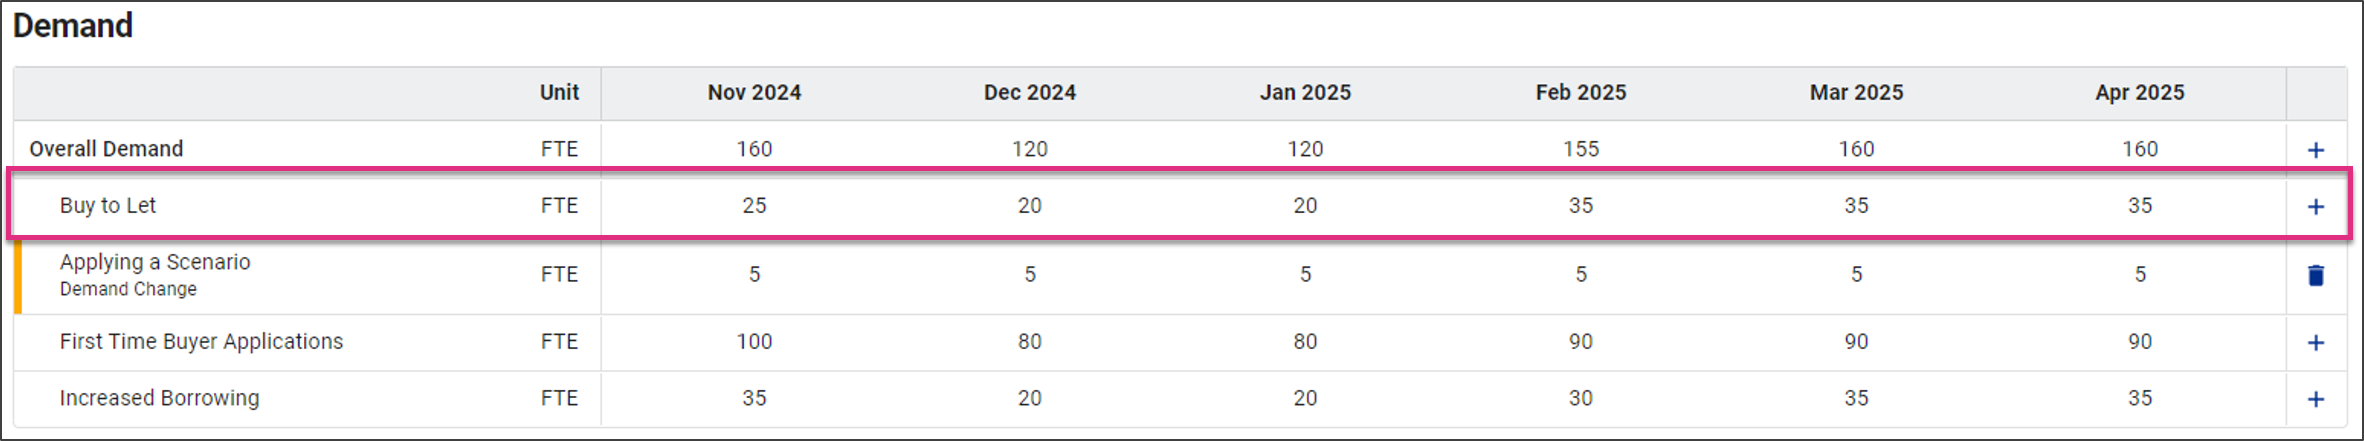
When you apply the Scenario, a new row will appear in your plan underneath the line item you applied the Scenario to. This details the name of the Scenario and the change it is making to your base values.
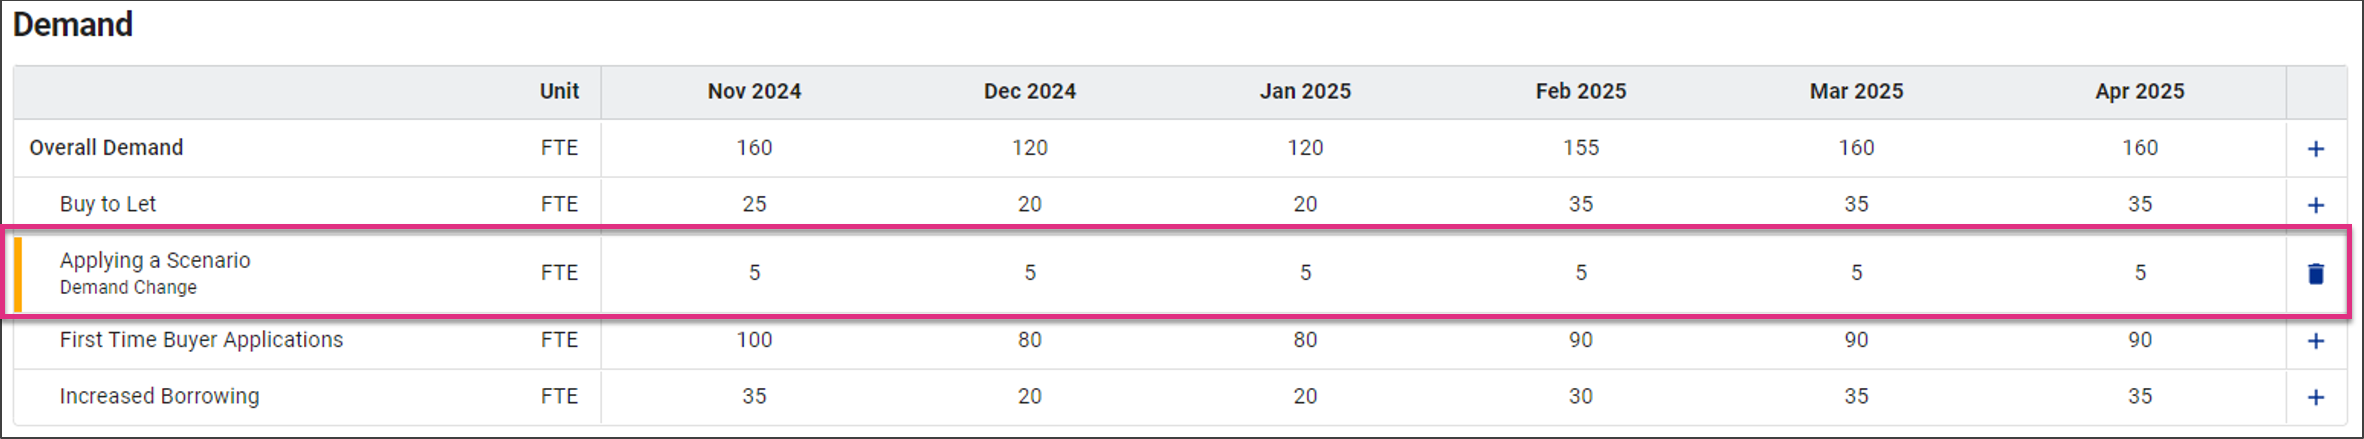
Your base values will also update to reflect the change. Your Scenario Plan will automatically save the changes as you are making them.
You can edit or delete your scenario via the  button:
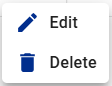
Edit will display the scenario you set and allow you to make changes.
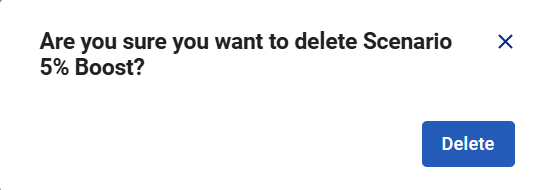
Delete will bring up the confirmation dialogue box:
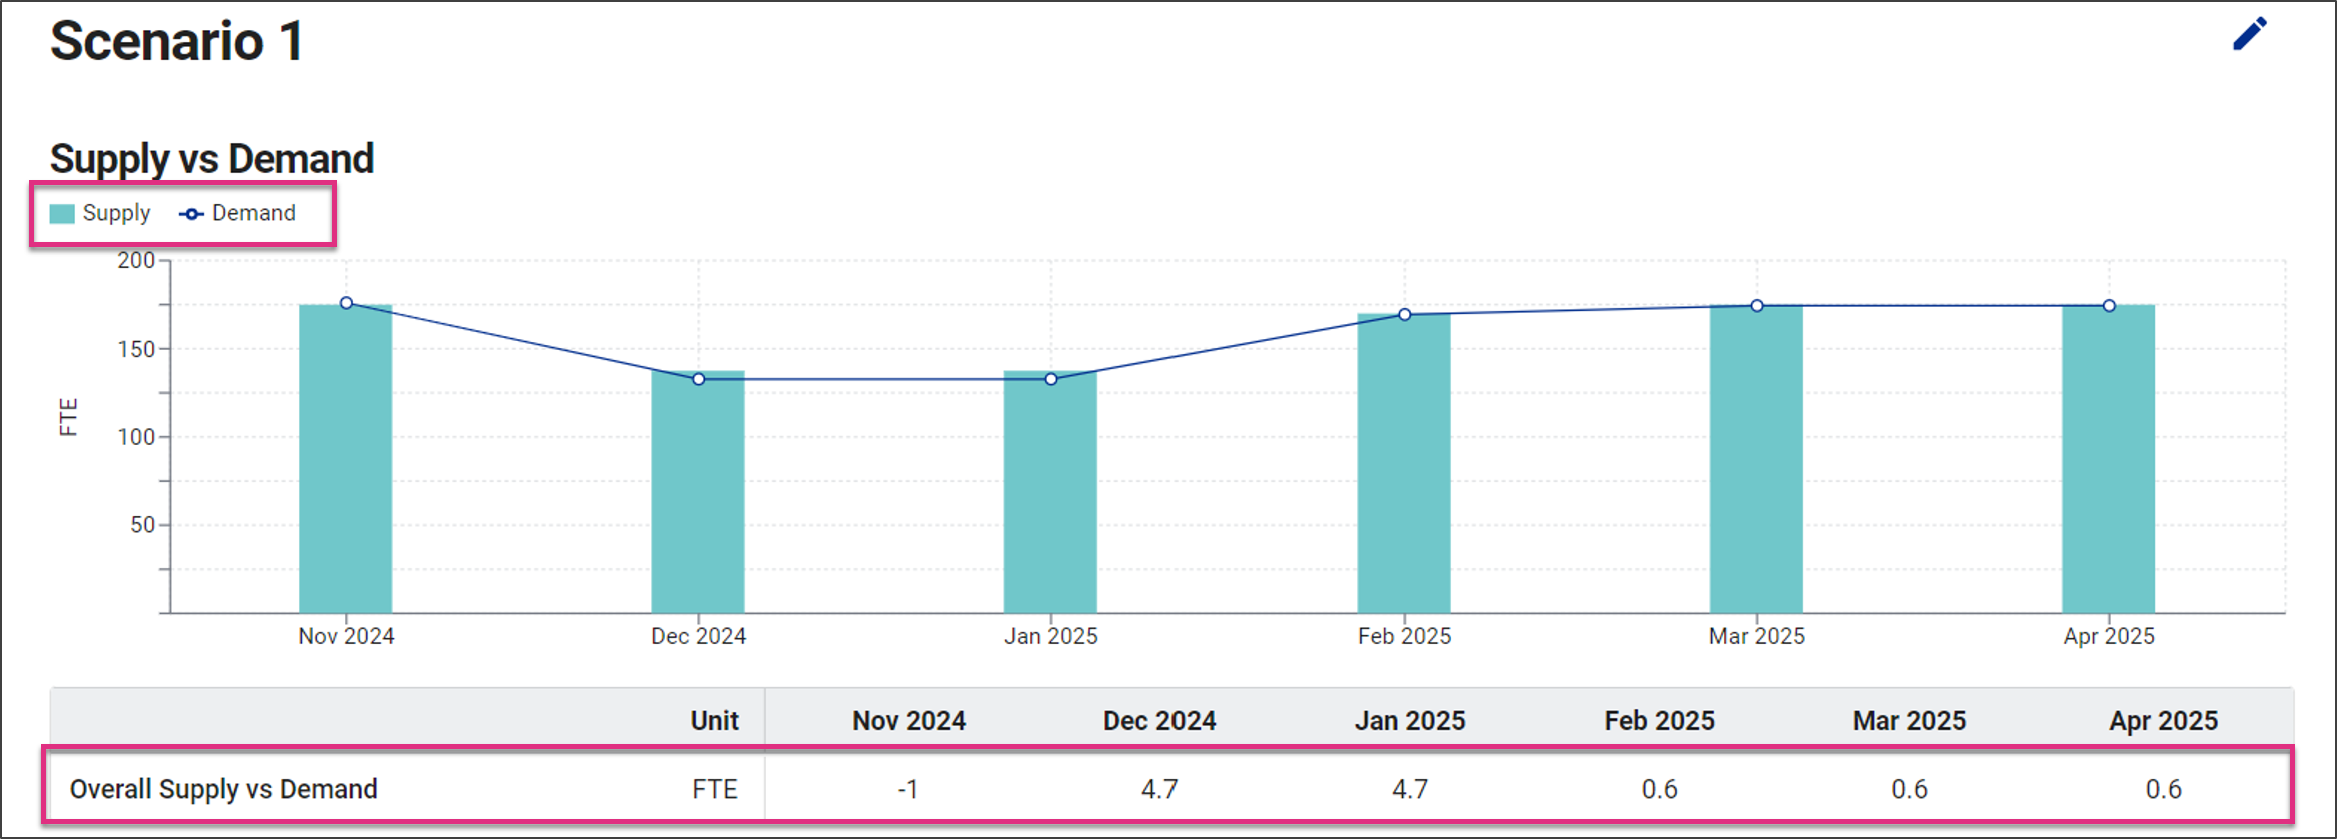
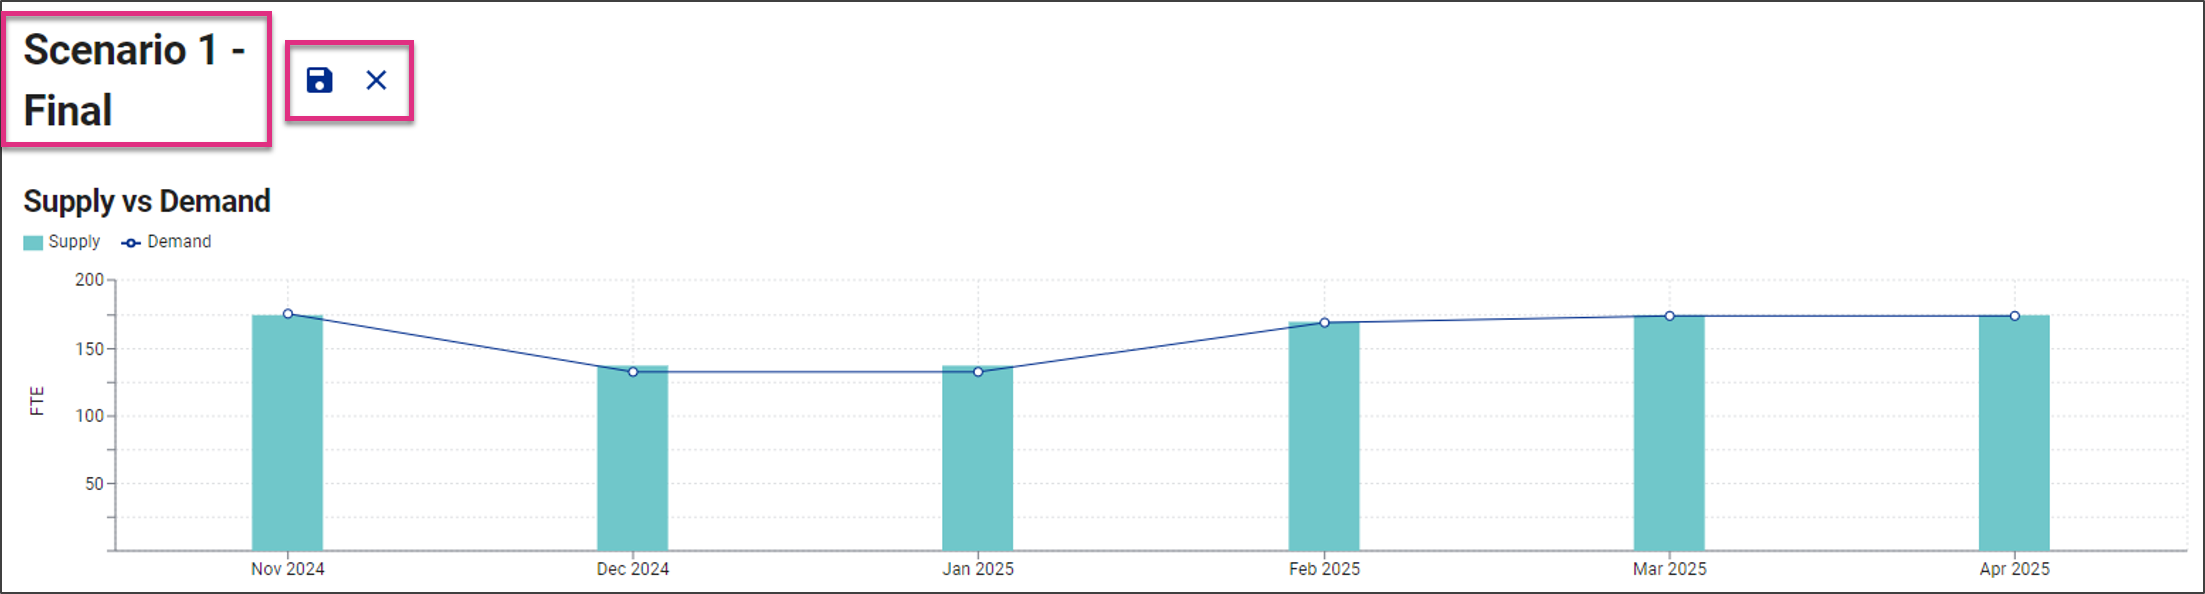
As you apply Scenarios to your plan your Supply vs Demand graph and Overall Supply vs Demand values will update to reflect the changes you are making, allowing you to see the impact of the changes you are making.
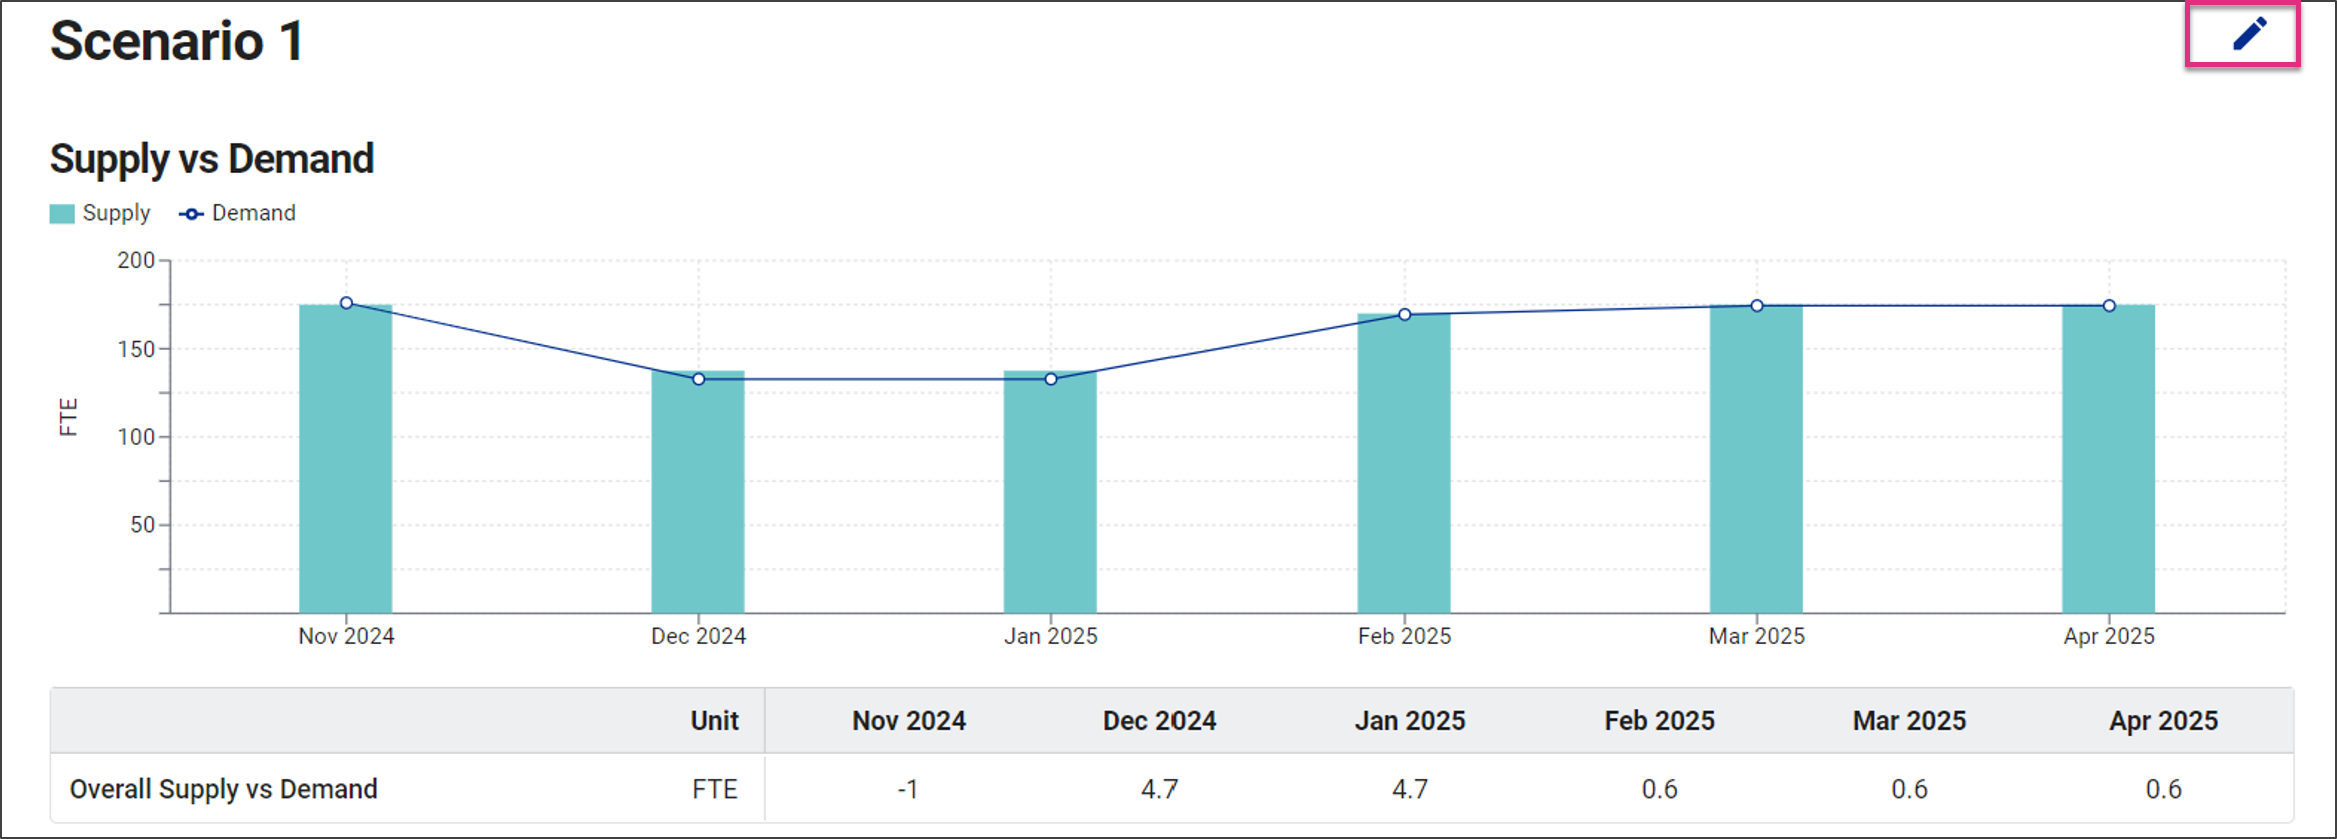
Once completed you may wish to update the name of your scenario plan to indicate that it is the plan you have decided to action, this is helpful if you have created multiple plans. To edit the plan name, select the  icon.
icon.
Overtype the plan name and click the ![]() icon to save your changes and
icon to save your changes and ![]() to cancel them.
to cancel them.